 Adminator
a425ce31e6
Adminator
a425ce31e6
- Mindmap mit Force-directed Layout (pages/mindmap.php) + Cross-Links
- 28 Eintraege im Fachartikel-Stil mit 113 Quellen + Inline-Referenzen [^n]
- Leichte-Sprache-Version fuer alle 28 Eintraege (short_easy, text_easy, examples.text_easy)
- 19 Infografiken (12 neu): co2-Keeling, klimawandel-Temp, kohlenstoff-Kreislauf, fotosynthese, energiemix-AT, methan-GWP, photovoltaik, wasserkraft, kipppunkt, biodiversitaet-LPI, permafrost, treibhausgas-GWP + bestehende (treibhauseffekt, ppm, windrad, albedo, fossile, kwh, co2-fussabdruck)
- 5 DALL-E-Reprasentationsbilder im Querformat (nachhaltigkeit, klimaneutralitaet, erneuerbare-energie, emissionen, pariser-abkommen)
- Alphabetische Sprungnavigation A-Z mit Buchstabenbannern
- Lightbox-Vollbild auf allen Infografiken mit expliziten SVG-Dimensionen (Safari/iPad-Fix)
- Easy-Sprache-Toggle pro Card mit localStorage-Persistenz
- 4 interaktive Experimente: kWh-Rennen, ppm-Finder, albedo-Slider, CO2-Fussabdruck-Rechner
- iPad-Optimierung: Touch-Ziele >=38px, Hover in @media (hover), touch-action
- Modul-Metadaten aus DB-Tabelle module_info (keine Hardcodes)
- Cache-Buster auf JS-Asset
- Schema-Erweiterung: glossar_sources, examples.text_easy

Co-Authored-By: Claude Opus 4.7 (1M context) <noreply@anthropic.com>
118 lines
5.9 KiB
XML
118 lines
5.9 KiB
XML
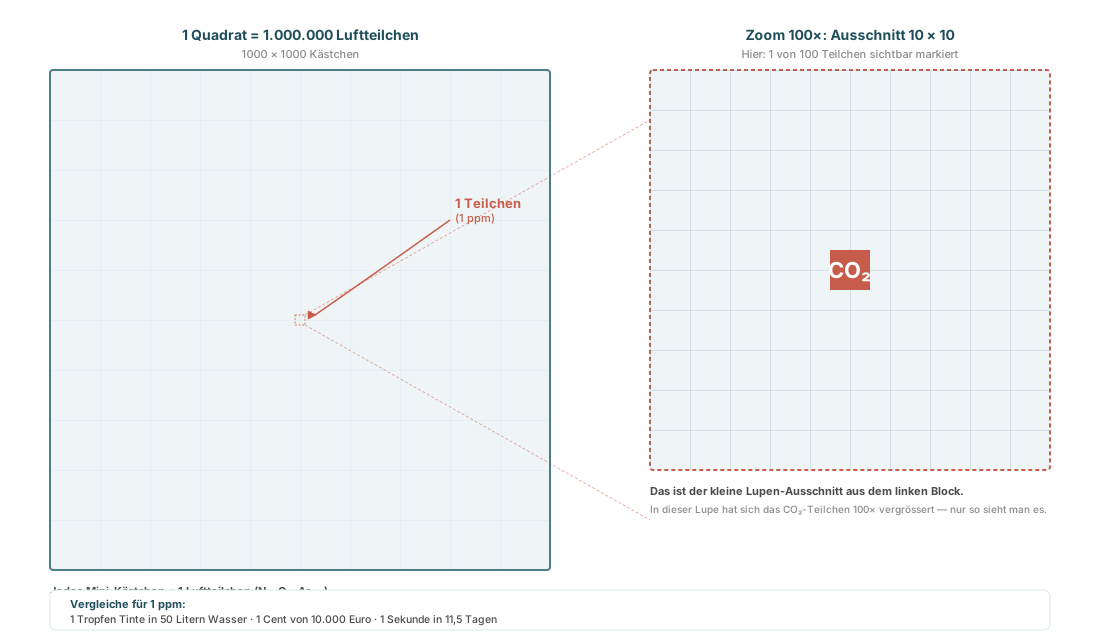


<svg xmlns="http://www.w3.org/2000/svg" viewBox="0 0 1100 640" font-family="Inter, system-ui, sans-serif" width="1100" height="640">
|
||
<defs>
|
||
<!-- Feines Hintergrund-Raster für den 1000x1000-Block -->
|
||
<pattern id="fineGrid" x="0" y="0" width="5" height="5" patternUnits="userSpaceOnUse">
|
||
<path d="M 5 0 L 0 0 L 0 5" fill="none" stroke="#4a7c8a" stroke-width="0.05" opacity="0.35"/>
|
||
</pattern>
|
||
<pattern id="coarseGrid" x="0" y="0" width="50" height="50" patternUnits="userSpaceOnUse">
|
||
<path d="M 50 0 L 0 0 L 0 50" fill="none" stroke="#4a7c8a" stroke-width="0.25" opacity="0.5"/>
|
||
</pattern>
|
||
<!-- Grobes Raster für den Zoom-Ausschnitt (10x10) -->
|
||
<pattern id="zoomGrid" x="0" y="0" width="40" height="40" patternUnits="userSpaceOnUse">
|
||
<path d="M 40 0 L 0 0 L 0 40" fill="none" stroke="#4a7c8a" stroke-width="1" opacity="0.35"/>
|
||
</pattern>
|
||
<!-- Pfeilspitze -->
|
||
<marker id="arrow" viewBox="0 0 10 10" refX="8" refY="5" markerWidth="6" markerHeight="6" orient="auto">
|
||
<path d="M 0 0 L 10 5 L 0 10 z" fill="#c85c4a"/>
|
||
</marker>
|
||
</defs>
|
||
|
||
<!-- ========== LINKE SEITE: 1.000.000 Teilchen ========== -->
|
||
<g transform="translate(50, 70)">
|
||
<!-- Titel -->
|
||
<text x="250" y="-30" font-size="14" font-weight="800" fill="#1f4e5a" text-anchor="middle">
|
||
1 Quadrat = 1.000.000 Luftteilchen
|
||
</text>
|
||
<text x="250" y="-12" font-size="11" fill="#8a8a8a" text-anchor="middle">
|
||
1000 × 1000 Kästchen
|
||
</text>
|
||
|
||
<!-- Hintergrundblock -->
|
||
<rect x="0" y="0" width="500" height="500" fill="#eff5f6" stroke="#4a7c8a" stroke-width="2" rx="3"/>
|
||
<!-- Feines Raster (alle 5 Units = alle 0,5% des Blocks) -->
|
||
<rect x="0" y="0" width="500" height="500" fill="url(#fineGrid)"/>
|
||
<!-- Grobes Raster (alle 50 Units = alle 5%) -->
|
||
<rect x="0" y="0" width="500" height="500" fill="url(#coarseGrid)"/>
|
||
|
||
<!-- DAS EINE TEILCHEN — mathematisch korrekt 0,5 × 0,5 SVG-Units bei 500×500-Block = 1/1.000.000 -->
|
||
<!-- Position (250, 250) — in der Mitte -->
|
||
<rect x="249.75" y="249.75" width="0.5" height="0.5" fill="#c85c4a"/>
|
||
|
||
<!-- Pulsierender Glow-Kreis, damit man das Pixel überhaupt findet -->
|
||
<circle cx="250" cy="250" r="0" fill="none" stroke="#c85c4a" stroke-width="1.5">
|
||
<animate attributeName="r" values="4;45;4" dur="2.8s" repeatCount="indefinite"/>
|
||
<animate attributeName="opacity" values="0.9;0;0.9" dur="2.8s" repeatCount="indefinite"/>
|
||
<animate attributeName="stroke-width" values="2;0.3;2" dur="2.8s" repeatCount="indefinite"/>
|
||
</circle>
|
||
<!-- Zweiter Glow, versetzt für sanfteren Puls -->
|
||
<circle cx="250" cy="250" r="0" fill="none" stroke="#c85c4a" stroke-width="1">
|
||
<animate attributeName="r" values="0;30;0" dur="2.8s" begin="1.4s" repeatCount="indefinite"/>
|
||
<animate attributeName="opacity" values="0.7;0;0.7" dur="2.8s" begin="1.4s" repeatCount="indefinite"/>
|
||
</circle>
|
||
|
||
<!-- Lupen-Ausschnitt als gestricheltes Viereck (10×10 Einheiten) — zeigt was im Zoom rechts vergrössert wird -->
|
||
<rect x="245" y="245" width="10" height="10" fill="none" stroke="#c85c4a" stroke-width="0.8" stroke-dasharray="2 1.5"/>
|
||
|
||
<!-- Pfeil zum Pixel -->
|
||
<path d="M 400 150 Q 330 200 265 245" fill="none" stroke="#c85c4a" stroke-width="1.5" marker-end="url(#arrow)"/>
|
||
<text x="405" y="138" font-size="13" font-weight="700" fill="#c85c4a">1 Teilchen</text>
|
||
<text x="405" y="152" font-size="11" fill="#c85c4a">(1 ppm)</text>
|
||
|
||
<!-- Erklärung unter dem Block -->
|
||
<text x="0" y="525" font-size="11" fill="#4a4a4a" font-weight="600">
|
||
Jedes Mini-Kästchen = 1 Luftteilchen (N₂, O₂, Ar …)
|
||
</text>
|
||
<text x="0" y="543" font-size="10" fill="#8a8a8a">
|
||
Das rote Kästchen ist so klein, dass du es kaum siehst — genau darum geht es.
|
||
</text>
|
||
</g>
|
||
|
||
<!-- Verbindungslinien vom Lupen-Ausschnitt zum Zoom-Block -->
|
||
<g stroke="#c85c4a" stroke-width="0.8" stroke-dasharray="3 2" fill="none" opacity="0.6">
|
||
<line x1="305" y1="315" x2="650" y2="120"/>
|
||
<line x1="305" y1="325" x2="650" y2="520"/>
|
||
</g>
|
||
|
||
<!-- ========== RECHTE SEITE: Zoom 100× (10×10 Ausschnitt) ========== -->
|
||
<g transform="translate(650, 70)">
|
||
<!-- Titel -->
|
||
<text x="200" y="-30" font-size="14" font-weight="800" fill="#1f4e5a" text-anchor="middle">
|
||
Zoom 100×: Ausschnitt 10 × 10
|
||
</text>
|
||
<text x="200" y="-12" font-size="11" fill="#8a8a8a" text-anchor="middle">
|
||
Hier: 1 von 100 Teilchen sichtbar markiert
|
||
</text>
|
||
|
||
<!-- Zoom-Block -->
|
||
<rect x="0" y="0" width="400" height="400" fill="#eff5f6" stroke="#c85c4a" stroke-width="2" stroke-dasharray="4 3" rx="3"/>
|
||
<!-- Grobes Raster (10×10) -->
|
||
<rect x="0" y="0" width="400" height="400" fill="url(#zoomGrid)"/>
|
||
|
||
<!-- Das markierte Teilchen = 40×40 im Zoom (= 1/100 der Zoom-Fläche, entspricht 1/1.000.000 im Original) -->
|
||
<rect x="180" y="180" width="40" height="40" fill="#c85c4a">
|
||
<animate attributeName="opacity" values="1;0.6;1" dur="2.8s" repeatCount="indefinite"/>
|
||
</rect>
|
||
<!-- Weißes Fragezeichen / Hinweis im Pixel -->
|
||
<text x="200" y="208" font-size="22" font-weight="900" fill="#fff" text-anchor="middle">CO₂</text>
|
||
|
||
<!-- Erklärung -->
|
||
<text x="0" y="425" font-size="11" fill="#4a4a4a" font-weight="600">
|
||
Das ist der kleine Lupen-Ausschnitt aus dem linken Block.
|
||
</text>
|
||
<text x="0" y="443" font-size="10" fill="#8a8a8a">
|
||
In dieser Lupe hat sich das CO₂-Teilchen 100× vergrössert — nur so sieht man es.
|
||
</text>
|
||
</g>
|
||
|
||
<!-- ========== UNTEN: Didaktische Vergleiche ========== -->
|
||
<g transform="translate(50, 590)">
|
||
<rect x="0" y="0" width="1000" height="40" fill="#fff" stroke="#dae8ec" stroke-width="1" rx="6"/>
|
||
<text x="20" y="18" font-size="11" fill="#1f4e5a" font-weight="700">
|
||
Vergleiche für 1 ppm:
|
||
</text>
|
||
<text x="20" y="33" font-size="10.5" fill="#4a4a4a">
|
||
1 Tropfen Tinte in 50 Litern Wasser · 1 Cent von 10.000 Euro · 1 Sekunde in 11,5 Tagen
|
||
</text>
|
||
</g>
|
||
</svg>
|