 Adminator
a425ce31e6
Adminator
a425ce31e6
- Mindmap mit Force-directed Layout (pages/mindmap.php) + Cross-Links
- 28 Eintraege im Fachartikel-Stil mit 113 Quellen + Inline-Referenzen [^n]
- Leichte-Sprache-Version fuer alle 28 Eintraege (short_easy, text_easy, examples.text_easy)
- 19 Infografiken (12 neu): co2-Keeling, klimawandel-Temp, kohlenstoff-Kreislauf, fotosynthese, energiemix-AT, methan-GWP, photovoltaik, wasserkraft, kipppunkt, biodiversitaet-LPI, permafrost, treibhausgas-GWP + bestehende (treibhauseffekt, ppm, windrad, albedo, fossile, kwh, co2-fussabdruck)
- 5 DALL-E-Reprasentationsbilder im Querformat (nachhaltigkeit, klimaneutralitaet, erneuerbare-energie, emissionen, pariser-abkommen)
- Alphabetische Sprungnavigation A-Z mit Buchstabenbannern
- Lightbox-Vollbild auf allen Infografiken mit expliziten SVG-Dimensionen (Safari/iPad-Fix)
- Easy-Sprache-Toggle pro Card mit localStorage-Persistenz
- 4 interaktive Experimente: kWh-Rennen, ppm-Finder, albedo-Slider, CO2-Fussabdruck-Rechner
- iPad-Optimierung: Touch-Ziele >=38px, Hover in @media (hover), touch-action
- Modul-Metadaten aus DB-Tabelle module_info (keine Hardcodes)
- Cache-Buster auf JS-Asset
- Schema-Erweiterung: glossar_sources, examples.text_easy

Co-Authored-By: Claude Opus 4.7 (1M context) <noreply@anthropic.com>
59 lines
3.8 KiB
XML
59 lines
3.8 KiB
XML
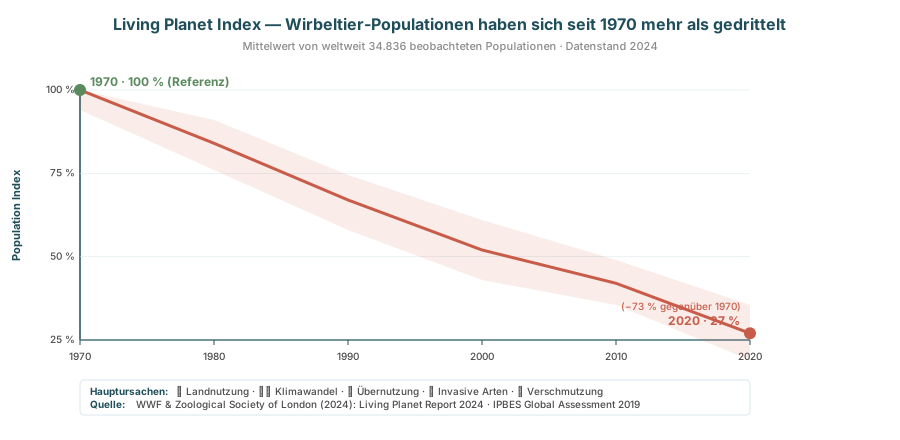


<svg xmlns="http://www.w3.org/2000/svg" viewBox="0 0 900 440" font-family="Inter, system-ui, sans-serif" width="900" height="440">
|
||
<text x="450" y="30" font-size="16" font-weight="800" fill="#1f4e5a" text-anchor="middle">
|
||
Living Planet Index — Wirbeltier-Populationen haben sich seit 1970 mehr als gedrittelt
|
||
</text>
|
||
<text x="450" y="50" font-size="11" fill="#8a8a8a" text-anchor="middle">
|
||
Mittelwert von weltweit 34.836 beobachteten Populationen · Datenstand 2024
|
||
</text>
|
||
|
||
<!-- Plot: x 80..750, y 90..340. X: 1970..2020 = 50 a in 670 px → 13.4 px/a. Y: 100%..25% = 75% in 250 px → 3.33 px/% -->
|
||
<line x1="80" y1="340" x2="750" y2="340" stroke="#1f4e5a" stroke-width="1.5"/>
|
||
<line x1="80" y1="90" x2="80" y2="340" stroke="#1f4e5a" stroke-width="1.5"/>
|
||
|
||
<!-- Y Grid -->
|
||
<g font-size="10" fill="#4a4a4a" text-anchor="end">
|
||
<line x1="80" y1="90" x2="750" y2="90" stroke="#dae8ec" stroke-width=".5"/><text x="74" y="93">100 %</text>
|
||
<line x1="80" y1="173.3" x2="750" y2="173.3" stroke="#dae8ec" stroke-width=".5"/><text x="74" y="176.3">75 %</text>
|
||
<line x1="80" y1="256.7" x2="750" y2="256.7" stroke="#dae8ec" stroke-width=".5"/><text x="74" y="259.7">50 %</text>
|
||
<line x1="80" y1="340" x2="750" y2="340" stroke="#dae8ec" stroke-width=".5"/><text x="74" y="343">25 %</text>
|
||
</g>
|
||
<text x="20" y="215" font-size="11" font-weight="700" fill="#1f4e5a" transform="rotate(-90 20 215)" text-anchor="middle">Population Index</text>
|
||
|
||
<!-- X Achse -->
|
||
<g font-size="10" fill="#4a4a4a" text-anchor="middle">
|
||
<line x1="80" y1="340" x2="80" y2="345" stroke="#1f4e5a"/><text x="80" y="360">1970</text>
|
||
<line x1="214" y1="340" x2="214" y2="345" stroke="#1f4e5a"/><text x="214" y="360">1980</text>
|
||
<line x1="348" y1="340" x2="348" y2="345" stroke="#1f4e5a"/><text x="348" y="360">1990</text>
|
||
<line x1="482" y1="340" x2="482" y2="345" stroke="#1f4e5a"/><text x="482" y="360">2000</text>
|
||
<line x1="616" y1="340" x2="616" y2="345" stroke="#1f4e5a"/><text x="616" y="360">2010</text>
|
||
<line x1="750" y1="340" x2="750" y2="345" stroke="#1f4e5a"/><text x="750" y="360">2020</text>
|
||
</g>
|
||
|
||
<!-- Linie — grobe Approximation der globalen LPI-Kurve 1970→2020 (100→27%) -->
|
||
<!-- Stützpunkte %: 1970=100, 1980=84, 1990=67, 2000=52, 2010=42, 2020=27
|
||
y(%) = 90 + (100-%)*3.333 -->
|
||
<polyline fill="none" stroke="#c85c4a" stroke-width="3" stroke-linejoin="round"
|
||
points="80,90 214,143.3 348,200 482,250 616,283.3 750,333.3"/>
|
||
<!-- Unsicherheitsband (sehr vereinfacht) -->
|
||
<polyline fill="#c85c4a" fill-opacity=".12" stroke="none"
|
||
points="80,90 214,120 348,175 482,220 616,260 750,305 750,360 616,305 482,280 348,230 214,170 80,110"/>
|
||
|
||
<!-- Endmarke -->
|
||
<circle cx="750" cy="333.3" r="6" fill="#c85c4a"/>
|
||
<text x="740" y="325" font-size="12" font-weight="800" fill="#c85c4a" text-anchor="end">2020 · 27 %</text>
|
||
<text x="740" y="310" font-size="10" fill="#c85c4a" text-anchor="end">(−73 % gegenüber 1970)</text>
|
||
|
||
<!-- Startmarke -->
|
||
<circle cx="80" cy="90" r="6" fill="#5a8a5e"/>
|
||
<text x="90" y="86" font-size="12" font-weight="800" fill="#5a8a5e">1970 · 100 % (Referenz)</text>
|
||
|
||
<!-- Ursachen-Icons -->
|
||
<g transform="translate(80,380)">
|
||
<rect x="0" y="0" width="670" height="35" rx="4" fill="#fff" stroke="#dae8ec"/>
|
||
<text x="10" y="15" font-size="10" font-weight="800" fill="#1f4e5a">Hauptursachen:</text>
|
||
<text x="96" y="15" font-size="10" fill="#4a4a4a">🌾 Landnutzung · 🌡️ Klimawandel · 🪓 Übernutzung · 🐀 Invasive Arten · 🏭 Verschmutzung</text>
|
||
<text x="10" y="28" font-size="10" font-weight="800" fill="#1f4e5a">Quelle:</text>
|
||
<text x="56" y="28" font-size="10" fill="#4a4a4a">WWF & Zoological Society of London (2024): Living Planet Report 2024 · IPBES Global Assessment 2019</text>
|
||
</g>
|
||
</svg>
|