 Adminator
a425ce31e6
Adminator
a425ce31e6
- Mindmap mit Force-directed Layout (pages/mindmap.php) + Cross-Links
- 28 Eintraege im Fachartikel-Stil mit 113 Quellen + Inline-Referenzen [^n]
- Leichte-Sprache-Version fuer alle 28 Eintraege (short_easy, text_easy, examples.text_easy)
- 19 Infografiken (12 neu): co2-Keeling, klimawandel-Temp, kohlenstoff-Kreislauf, fotosynthese, energiemix-AT, methan-GWP, photovoltaik, wasserkraft, kipppunkt, biodiversitaet-LPI, permafrost, treibhausgas-GWP + bestehende (treibhauseffekt, ppm, windrad, albedo, fossile, kwh, co2-fussabdruck)
- 5 DALL-E-Reprasentationsbilder im Querformat (nachhaltigkeit, klimaneutralitaet, erneuerbare-energie, emissionen, pariser-abkommen)
- Alphabetische Sprungnavigation A-Z mit Buchstabenbannern
- Lightbox-Vollbild auf allen Infografiken mit expliziten SVG-Dimensionen (Safari/iPad-Fix)
- Easy-Sprache-Toggle pro Card mit localStorage-Persistenz
- 4 interaktive Experimente: kWh-Rennen, ppm-Finder, albedo-Slider, CO2-Fussabdruck-Rechner
- iPad-Optimierung: Touch-Ziele >=38px, Hover in @media (hover), touch-action
- Modul-Metadaten aus DB-Tabelle module_info (keine Hardcodes)
- Cache-Buster auf JS-Asset
- Schema-Erweiterung: glossar_sources, examples.text_easy

Co-Authored-By: Claude Opus 4.7 (1M context) <noreply@anthropic.com>
83 lines
4.9 KiB
XML
83 lines
4.9 KiB
XML
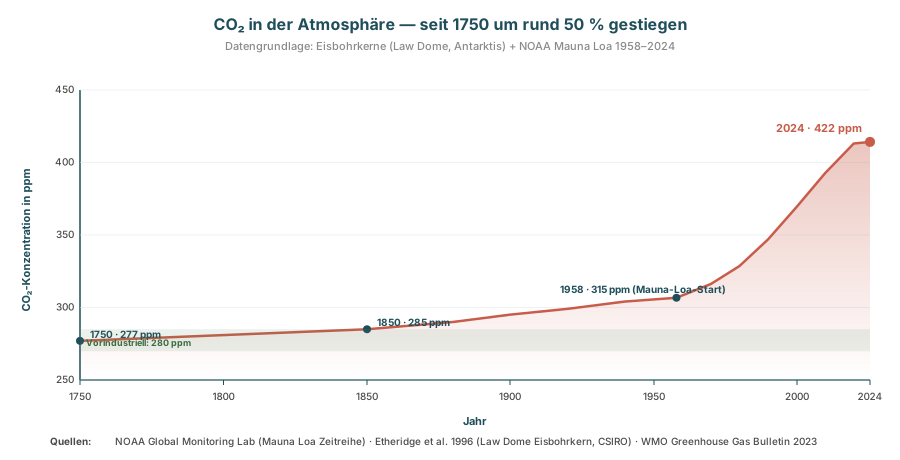


<svg xmlns="http://www.w3.org/2000/svg" viewBox="0 0 900 460" font-family="Inter, system-ui, sans-serif" width="900" height="460">
|
||
<defs>
|
||
<linearGradient id="co2-fill" x1="0" y1="0" x2="0" y2="1">
|
||
<stop offset="0" stop-color="#c85c4a" stop-opacity=".35"/>
|
||
<stop offset="1" stop-color="#c85c4a" stop-opacity="0"/>
|
||
</linearGradient>
|
||
</defs>
|
||
<text x="450" y="30" font-size="16" font-weight="800" fill="#1f4e5a" text-anchor="middle">
|
||
CO₂ in der Atmosphäre — seit 1750 um rund 50 % gestiegen
|
||
</text>
|
||
<text x="450" y="50" font-size="11" fill="#8a8a8a" text-anchor="middle">
|
||
Datengrundlage: Eisbohrkerne (Law Dome, Antarktis) + NOAA Mauna Loa 1958–2024
|
||
</text>
|
||
|
||
<!-- Achsen -->
|
||
<!-- Plot-Fläche: x 80..870, y 90..380 -->
|
||
<line x1="80" y1="380" x2="870" y2="380" stroke="#1f4e5a" stroke-width="1.5"/>
|
||
<line x1="80" y1="90" x2="80" y2="380" stroke="#1f4e5a" stroke-width="1.5"/>
|
||
|
||
<!-- Y-Grid + Labels (ppm) -->
|
||
<g font-size="10" fill="#4a4a4a" text-anchor="end">
|
||
<!-- Range: 250 → 450 ppm = 200 ppm auf 290 px → 1,45 px/ppm -->
|
||
<!-- Positionen: 250(380), 300(307.5), 350(235), 400(162.5), 450(90) -->
|
||
<line x1="80" y1="380" x2="870" y2="380" stroke="#dae8ec" stroke-width=".5"/>
|
||
<line x1="80" y1="307.5" x2="870" y2="307.5" stroke="#dae8ec" stroke-width=".5"/>
|
||
<line x1="80" y1="235" x2="870" y2="235" stroke="#dae8ec" stroke-width=".5"/>
|
||
<line x1="80" y1="162.5" x2="870" y2="162.5" stroke="#dae8ec" stroke-width=".5"/>
|
||
<line x1="80" y1="90" x2="870" y2="90" stroke="#dae8ec" stroke-width=".5"/>
|
||
<text x="74" y="383">250</text>
|
||
<text x="74" y="310.5">300</text>
|
||
<text x="74" y="238">350</text>
|
||
<text x="74" y="165.5">400</text>
|
||
<text x="74" y="93">450</text>
|
||
</g>
|
||
<text x="30" y="240" font-size="11" font-weight="700" fill="#1f4e5a" transform="rotate(-90 30 240)" text-anchor="middle">CO₂-Konzentration in ppm</text>
|
||
|
||
<!-- X-Achse: 1750 → 2025 = 275 Jahre auf 790 px → 2,87 px/Jahr -->
|
||
<!-- Jahre: 1750(80), 1800(223.5), 1850(367), 1900(510), 1950(654), 2000(797), 2025(870) -->
|
||
<g font-size="10" fill="#4a4a4a" text-anchor="middle">
|
||
<line x1="80" y1="380" x2="80" y2="385" stroke="#1f4e5a"/><text x="80" y="400">1750</text>
|
||
<line x1="223.5" y1="380" x2="223.5" y2="385" stroke="#1f4e5a"/><text x="223.5" y="400">1800</text>
|
||
<line x1="367" y1="380" x2="367" y2="385" stroke="#1f4e5a"/><text x="367" y="400">1850</text>
|
||
<line x1="510" y1="380" x2="510" y2="385" stroke="#1f4e5a"/><text x="510" y="400">1900</text>
|
||
<line x1="654" y1="380" x2="654" y2="385" stroke="#1f4e5a"/><text x="654" y="400">1950</text>
|
||
<line x1="797" y1="380" x2="797" y2="385" stroke="#1f4e5a"/><text x="797" y="400">2000</text>
|
||
<line x1="870" y1="380" x2="870" y2="385" stroke="#1f4e5a"/><text x="870" y="400">2024</text>
|
||
</g>
|
||
<text x="475" y="425" font-size="11" font-weight="700" fill="#1f4e5a" text-anchor="middle">Jahr</text>
|
||
|
||
<!-- Daten-Polyline (approximiert, Hauptstützpunkte aus Law Dome + NOAA) -->
|
||
<!-- Year → ppm:
|
||
1750→277, 1800→281, 1850→285, 1880→290, 1900→296, 1920→303,
|
||
1940→311, 1958→315, 1970→326, 1980→339, 1990→354, 2000→370,
|
||
2010→389, 2020→413, 2024→422
|
||
x = 80 + (year-1750)*2.87 y = 380 - (ppm-250)*1.45 -->
|
||
<polyline fill="url(#co2-fill)" stroke="none"
|
||
points="80,380 80,340.85 223.5,335.05 367,329.25 453.1,321.95 510,314.65 567.4,308.85 624.8,301.55 676.46,297.75 710.86,284 739.44,266.05 768.03,239.4 796.61,206.95 825.19,173.05 853.77,143.5 870,141.9 870,380"/>
|
||
<polyline fill="none" stroke="#c85c4a" stroke-width="2.5" stroke-linejoin="round"
|
||
points="80,340.85 223.5,335.05 367,329.25 453.1,321.95 510,314.65 567.4,308.85 624.8,301.55 676.46,297.75 710.86,284 739.44,266.05 768.03,239.4 796.61,206.95 825.19,173.05 853.77,143.5 870,141.9"/>
|
||
|
||
<!-- Markante Punkte -->
|
||
<g fill="#1f4e5a">
|
||
<circle cx="80" cy="340.85" r="4"/>
|
||
<text x="90" y="338" font-size="10" font-weight="700">1750 · 277 ppm</text>
|
||
<circle cx="367" cy="329.25" r="4"/>
|
||
<text x="377" y="326" font-size="10" font-weight="700">1850 · 285 ppm</text>
|
||
<circle cx="676.46" cy="297.75" r="4"/>
|
||
<text x="560" y="293" font-size="10" font-weight="700">1958 · 315 ppm (Mauna-Loa-Start)</text>
|
||
<circle cx="870" cy="141.9" r="5" fill="#c85c4a"/>
|
||
<text x="862" y="132" font-size="11" font-weight="800" fill="#c85c4a" text-anchor="end">2024 · 422 ppm</text>
|
||
</g>
|
||
|
||
<!-- Vorindustriell-Band -->
|
||
<rect x="80" y="329.25" width="790" height="22" fill="#5a8a5e" opacity=".12"/>
|
||
<text x="86" y="346" font-size="9" fill="#3a6b3e" font-weight="700">Vorindustriell: 280 ppm</text>
|
||
|
||
<!-- Fußzeile -->
|
||
<g transform="translate(50,430)">
|
||
<text x="0" y="15" font-size="10" fill="#4a4a4a" font-weight="700">Quellen:</text>
|
||
<text x="65" y="15" font-size="10" fill="#4a4a4a">NOAA Global Monitoring Lab (Mauna Loa Zeitreihe) · Etheridge et al. 1996 (Law Dome Eisbohrkern, CSIRO) · WMO Greenhouse Gas Bulletin 2023</text>
|
||
</g>
|
||
</svg>
|
